| Proportion of trained Retail colleagues | Measures the progress of our colleagues through the 3-Gears training programme. | We aim to have the majority of our colleagues trained to Gear 2 plus around two colleagues per store trained to the Gear 3 "guru" level. | By the end of the year 72% of our eligible Retail store colleagues were qualified at Gear 2 level. We also have a further 600 colleagues at Gear 3 level (equivalent to 1.3 per store). | 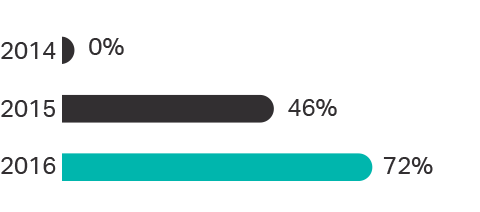
The above numbers represent the proportion of colleagues at Gear 2 level |
| Service-related Retail sales growth | Service-related sales is the income derived from the fitting or repair services themselves along with the associated product sold within the same transaction. | To grow service-related sales faster than total Retail sales growth. | Service-related sales grew by 8.5% in the year, with growth across the suite of our fitting and repair services. |  |
| Proportion of Retail sales matched to a customer | The proportion of sales in Halfords Retail that can be matched to a specific customer in our database. | To increase our understanding of who our customers are. We will do this by adding to our customer databases and combing them to create a single customer view. | For the 12 months to April 2016 we can match 15% of Retail sales to customers, up from 3% previously. | 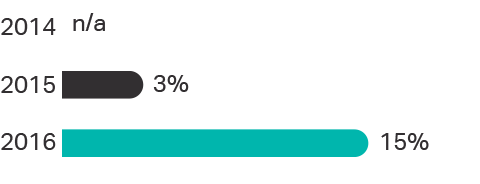 |
| Autocentre openings | The number of Autocentres opened in the year. | We believe that there is significant potential for new centres in the UK. We currently anticipate opening 10-15 a year over the medium-term. | 11 centres were opened during the year, all in the new concept style. |  |
| Cycle Republic stores (cumulative) | The number of Cycle Republic stores that are trading. | We do not have a fixed store rollout target. However we guided to have around 10 stores by the end of FY16. | We opened 6 stores in FY16, including our flagship store in Fenchurch Street, London, taking the total to 10 at the end of the year. | 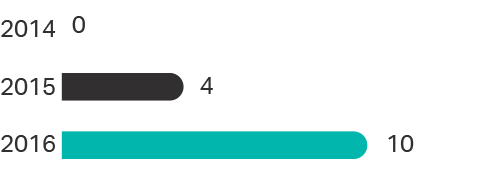 |
| Store and centre refreshes | The number of Retail stores and Autocentres refreshed in the year. | We are committed to refreshing the design of our stores and centres in order to improve the customer experience. | During the year we refreshed 25 Retail stores and 24 Autocentres. | 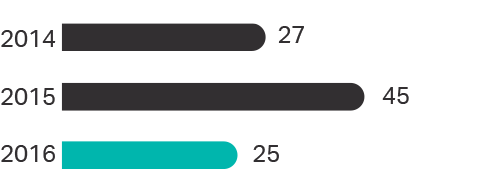
The above numbers represent the number of Retail stores refreshed |
| Online sales as a proportion of total Retail sales | Online sales as a proportion of total Retail sales. | We are committed to improving our online shopping experience for customers. | In FY16 our online sales represented 12.1% of total Retail sales. This proportion was unchanged in the year and reflects the higher mix of cycling sales online. | 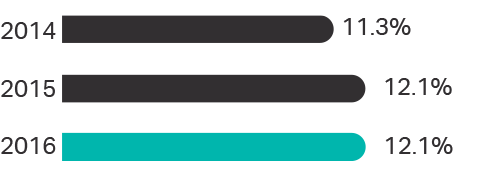 |